 GB
GB
 US
US

Contract prices edge up as demand surges and wind output dips
After a period of relative calm, electricity markets have shown renewed upward pressure, particularly in NSW and QLD, driven by stronger demand and reduced wind generation. While wholesale fluctuations remain modest overall, underlying contract trends are starting to shift, offering both risks and opportunities for commercial energy buyers as budget season approaches.

After a period of relative calm, electricity markets have shown renewed upward pressure, particularly in NSW and QLD, driven by stronger demand and reduced wind generation. While wholesale fluctuations remain modest overall, underlying contract trends are starting to shift, offering both risks and opportunities for commercial energy buyers as budget season approaches.
Key market insights:
-
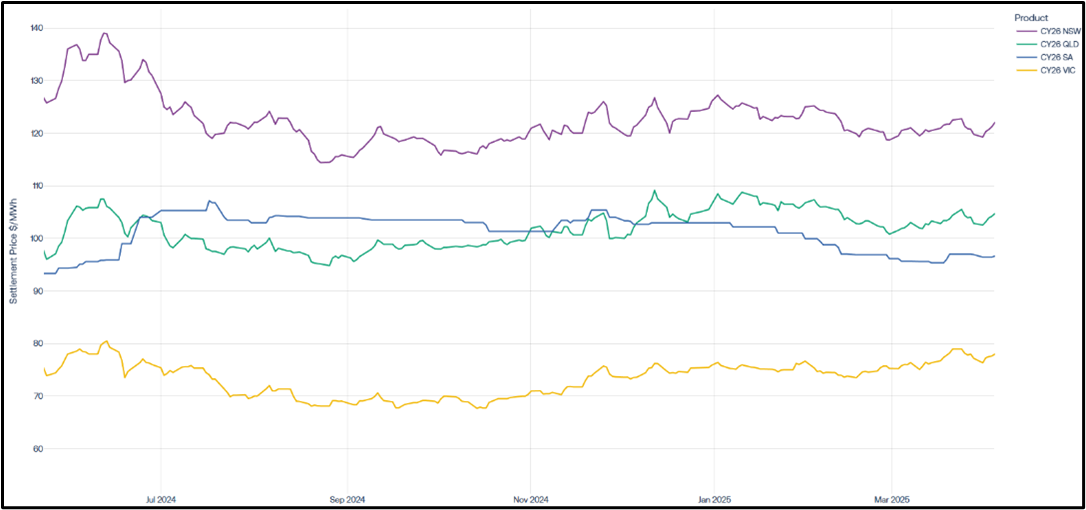
Spot and contract prices rise with demand
Higher electricity demand across NSW, QLD, VIC and SA pushed up spot prices in March, which in turn applied upward pressure on forward contract pricing — especially in the shorter-term CAL26 products.
-
Wind output drops, tightens supply
Lower-than-usual wind generation reduced available low-cost supply during the month, influencing the generation mix and contributing to price uplift.
-
Contract market trending slightly upwards
While still trading in a relatively narrow range, the contract market has shown a slight upward trend since May 2024, with QLD and NSW seeing the most movement.
-
Wholesale prices still stable in retail terms
Despite these shifts, wholesale prices have mostly stayed within a +/- $10/MWh band since late 2024, indicating continued relative stability for retail electricity rates.
-
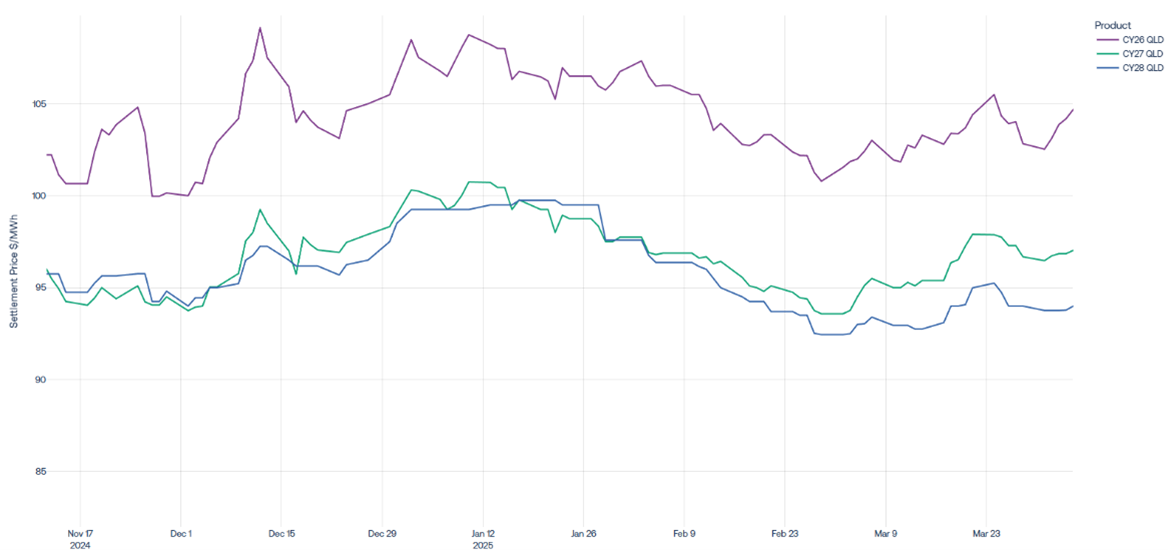
QLD remains heavily backwardated
Queensland’s forward contract curve continues to show steep backwardation — with longer-term pricing (e.g. 2028) significantly lower than near-term pricing.
What it means for businesses:
-
Opportunities to ‘smooth’ energy tariffs
For QLD-based energy users, backwardation presents a strategic opportunity: by locking in a multi-year contract (e.g. 2026–2028), businesses can blend down their average electricity price over time. Example: - 2026: $105/MWh
- 2027: $97/MWh
- 2028: $94/MWh
-
Budgeting considerations
With FY26 planning on the horizon, now’s a smart time to review supply contracts. While network costs and market fees are harder to control, contestable energy costs can be stabilised through tariff smoothing.
-
Regional differences apply
NSW and VIC don’t currently offer the same degree of backwardation. In these markets, businesses may need to consider shorter-term strategies or keep an eye on further developments before locking in longer deals.
Need help navigating the latest contract trends or want to explore how tariff smoothing could benefit your business?
Reach out to the SmartestEnergy team — we’re here to support your energy strategy with insights and flexible options.
People-powered progress
Explore key milestones, global initiatives, and our bold vision for the future. See how we're driving change—powered by people, guided by purpose.